
小規模店舗向け 売上・顧客管理テンプレート|Retail Sales & Customer OS for Small Shops
- ダウンロード商品¥ 1,500
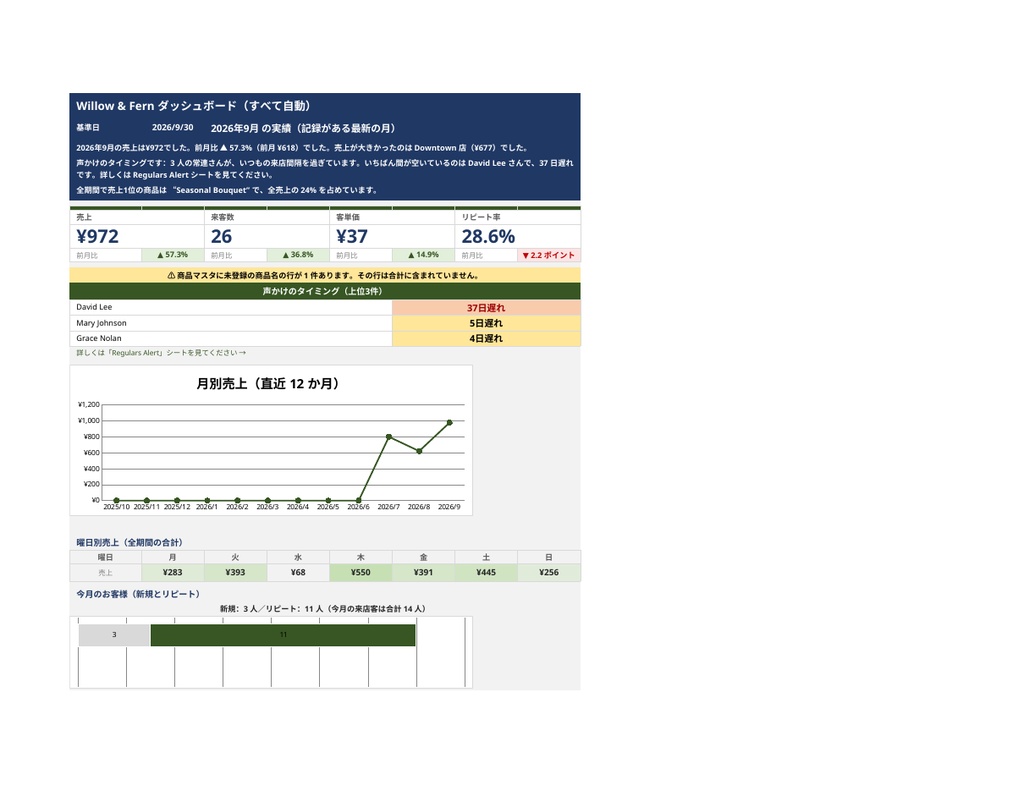

小さな店舗のための、売上記録と顧客管理のスプレッドシート・テンプレートです。 常連のお客様は「もう来ません」とは言いません。ただ来なくなるだけです。このテンプレートは、お客様ごとの来店リズムを自動で見張り、間隔が空きすぎた常連をアラートで知らせます。 ■ 中心機能:Regulars Alert(常連アラート) ・お客様ごとに平均来店間隔を自動計算し、それを超えた方を「何日遅れか」と一緒に一覧表示 ・サンプルデータでは、約10日おきに来ていた常連が37日来ていないケースを検出しています ・アラートの上位3件はダッシュボードにも表示されるので、ファイルを開くたびに目に入ります ■ 1画面ダッシュボード ・KPIカード4つ:今月の売上・来客数・客単価・リピート率(それぞれ前月比つき) ・今月の様子、声かけすべき常連、売上1位の商品を文章で教えてくれるインサイト行 ・12か月の売上グラフ、曜日別の売上、新規/リピート構成も1画面に収録 ・商品マスタと名前が一致しない売上行は警告で検出(集計漏れを防ぎます) ■ 使い方(3ステップ) 1. 商品マスタに商品名・カテゴリ・価格を登録(表記ゆれによる集計の分裂を防止) 2. 売上を Sales Log に1行ずつ記録(店舗・商品・支払方法はプルダウン選択) 3. あとは全部自動です ■ 収録内容(8シート) Start Here/Settings & Dictionary/Product Master/Sales Log/Dashboard/Customer View(お客様ごとの来店回数・累計金額・来店間隔・遅れ日数)/Regulars Alert/Sample Data ■ サンプルデータ入り 架空の花屋「Willow & Fern」(2店舗)の1四半期分(2026年7〜9月、売上合計 $2,386)を収録。売上1位は Seasonal Bouquet($570)、個数1位は Mini Bouquet(23個)。説明文中の数字はすべてこのサンプルから取っているので、開いてその場で確かめられます。 ■ 動作環境・仕様 ・Microsoft Excel 用.xlsx と、Google Sheets での使い方(xlsxのインポート手順と英語版コピーリンクを記載したテキストファイル)の両方が付属します ・収録容量:売上記録300行・商品50点・お客様60名まで(小規模店舗向けの設計です) ・お客様の情報はこのファイルの中だけに保存され、外部に送信されることはありません ※シート名とプルダウンの選択肢は英語表記ですが、使い方・項目の定義はすべて日本語で説明しています ■ 正直な注意点 ・価格は商品マスタから参照しています。マスタの価格を変更すると、過去の売上行の金額も新しい価格で再計算されます。回避方法(価格変更前に過去行の価格を固定する手順)は Settings & Dictionary に記載しています。初めて価格を変える前に必ずお読みください ・在庫・原価・利益の管理は含みません(売上と顧客の記録専用です) ・POSレジが顧客管理まで行っている店舗には不要です ■ 向いている方 ・売上をノートやレジ任せにしてきた小規模な小売店(花屋、雑貨店、ブティック、ベーカリー、サロンの物販コーナーなど) ・常連の大切さは分かっているけれど、全員の来店リズムを覚えていられない店主の方 ―――― Retail Sales & Customer OS for Small Shops — Log Every Sale Once, Never Forget a Regular One sales log for your small shop, a one-screen dashboard that reads it back to you — and a Regulars Alert that names the customers who have quietly stopped coming, while there's still time to reach out. Excel + Google Sheets. Every customer with a pattern gets an average visit interval. When someone goes past theirs, they appear on the Regulars Alert sheet — longest absence first, with exactly how many days they're overdue. In the sample data it flags a regular who used to come about every 10 days and is now 37 days overdue; the top 3 also sit on the Dashboard. The one-screen Dashboard: 4 KPI cards (this month's sales, visits, average spend, repeat rate — each with last-month delta), three plain-language insight lines, a 12-month sales chart, a sales-by-weekday strip, and new vs. returning customers. A warning line counts any logged product name that doesn't match the Product Master, so nothing silently vanishes from your totals. What's inside (8 sheets): Start Here / Settings & Dictionary / Product Master / Sales Log / Dashboard / Customer View / Regulars Alert / Sample Data. Sample: a fictional flower shop "Willow & Fern" (2 stores), one full quarter, $2,386 total. You get the Excel file (.xlsx) plus a text file with instructions for opening the xlsx in Google Sheets (upload it to Google Drive) and a copy link to the English Google Sheets version. Sized for a small shop: up to 300 sales-log rows, 50 products, 60 customers. Honest note: prices are pulled live from the Product Master, so changing a price also updates past rows — the documented workaround is in Settings & Dictionary; read it before your first price change. Customer information lives only inside this file; it is never sent anywhere.