
Economy & growth - World Data Cross-Analysis Kit (152 countries x 22 indicators)
- Digital4,980 JPY
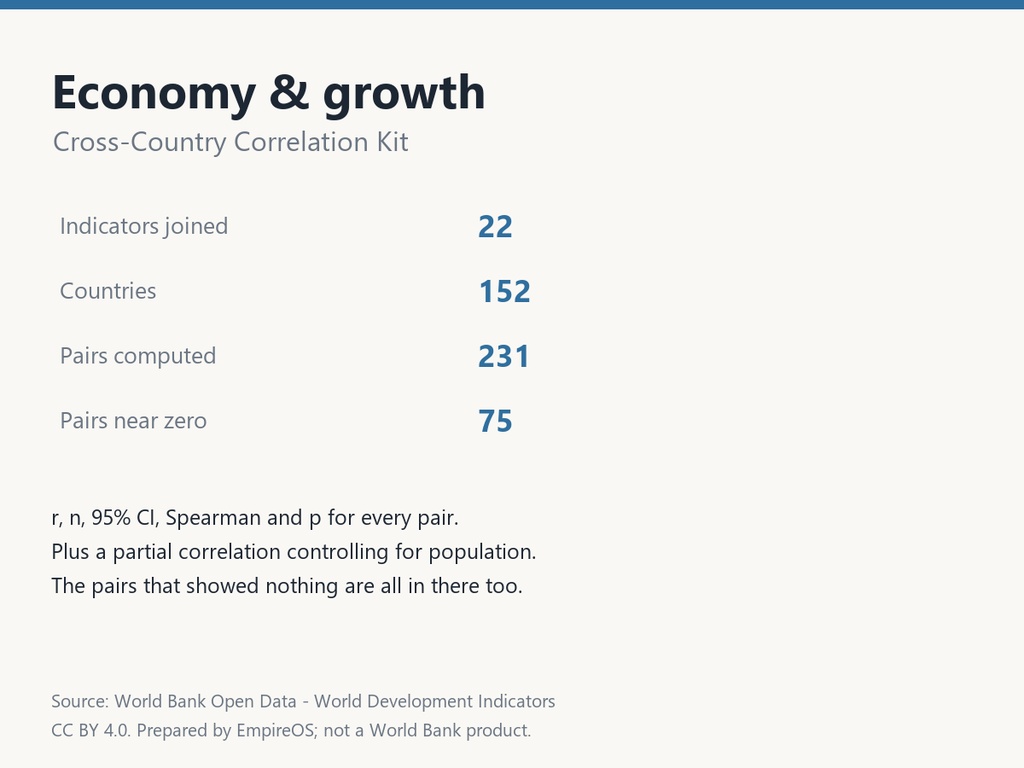
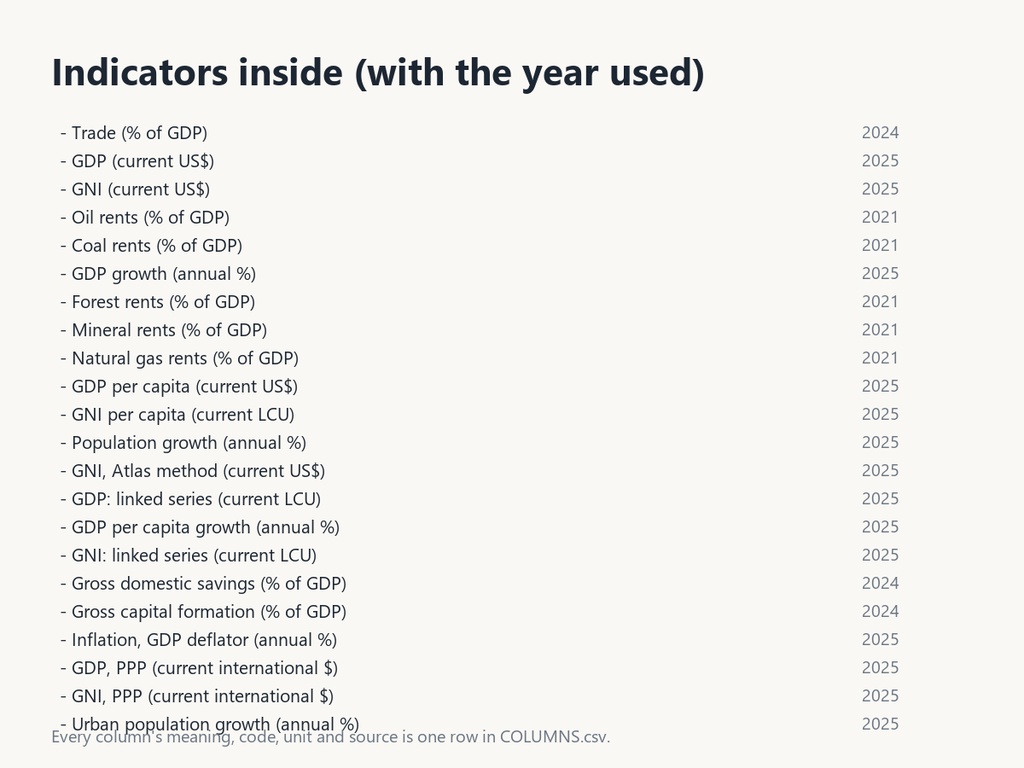
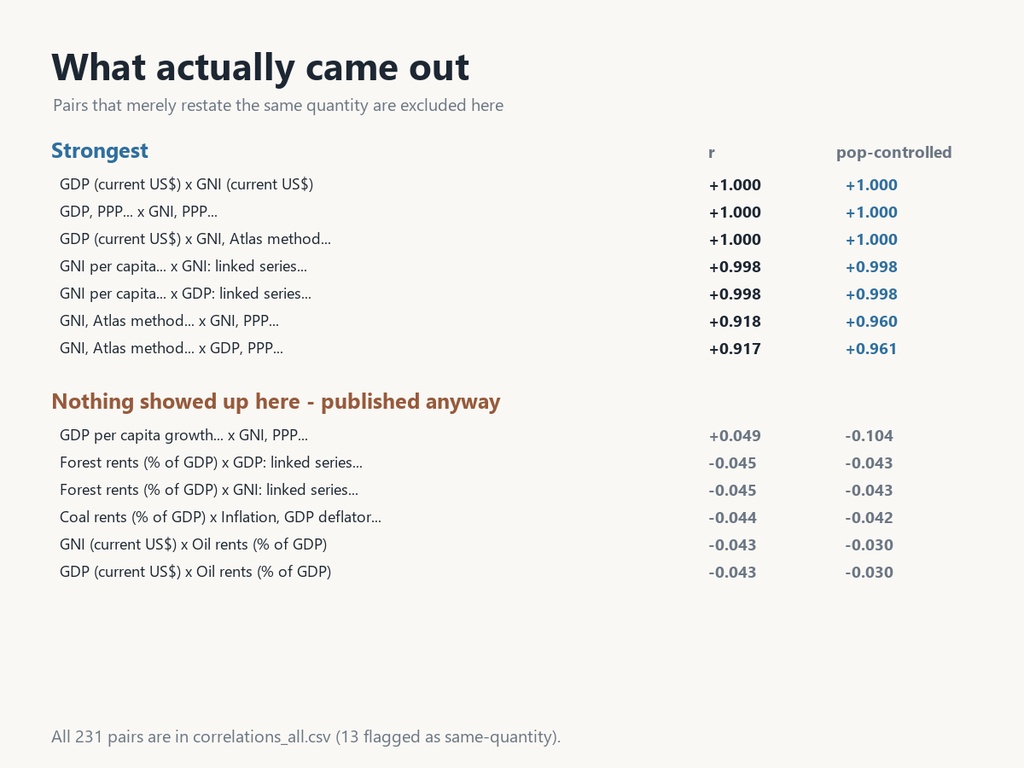


**This product is in English. 本商品の中身・文書はすべて英語です。** 22 World Bank indicators on economy & growth, joined on country code across **152 countries**, with **every pair of indicators correlated - all 231 of them**. Each pair carries r, n, a 95% confidence interval, Spearman's rho, a p value, and a **partial correlation controlling for total population**. ■ What is inside (all measured) - countries_joined.csv - 152 rows x 22 indicator columns, plus region and income group - COLUMNS.csv - what each column means, the year used, the World Bank indicator code, the unit, the source and how it was built - economy.sqlite - the same data plus the correlation table, openable with the Python standard library - correlations_all.csv - all 231 pairs: r, n, 95% CI, Spearman, p, population-controlled partial r, and the same-quantity flag - report.html - a single self-contained HTML report with every figure embedded. It opens offline and makes no network requests - BUILD_META.json - the build date, indicator count, pair count and what was dropped - LICENCE.txt ■ Indicators joined (22) - Trade (% of GDP) (2024) - GDP (current US$) (2025) - GNI (current US$) (2025) - Oil rents (% of GDP) (2021) - Coal rents (% of GDP) (2021) - GDP growth (annual %) (2025) - Forest rents (% of GDP) (2021) - Mineral rents (% of GDP) (2021) - Natural gas rents (% of GDP) (2021) - GDP per capita (current US$) (2025) - GNI per capita (current LCU) (2025) - Population growth (annual %) (2025) - GNI, Atlas method (current US$) (2025) - GDP: linked series (current LCU) (2025) - GDP per capita growth (annual %) (2025) - GNI: linked series (current LCU) (2025) - Gross domestic savings (% of GDP) (2024) - Gross capital formation (% of GDP) (2024) - Inflation, GDP deflator (annual %) (2025) - GDP, PPP (current international $) (2025) - GNI, PPP (current international $) (2025) - Urban population growth (annual %) (2025) ■ Two things that make this more than a data dump 1. Same-quantity pairs are flagged, not hidden.** Indicators that restate the same thing will always correlate strongly. 13 such pairs were detected automatically and excluded from the highlights - but they stay in the table, marked. 2. Every pair is also reported controlling for population (year 2025).** Large countries are large in almost everything. When a big raw r collapses after that control, the two were simply both large because the country is large. That difference is the point of this kit. ■ Examples of what actually came out - GDP (current US$) and GNI (current US$) r = +1.000 (population-controlled +1.000) - GDP, PPP (current international $) and GNI, PPP (current international $) r = +1.000 (population-controlled +1.000) - GDP (current US$) and GNI, Atlas method (current US$) r = +1.000 (population-controlled +1.000) - GNI per capita (current LCU) and GNI: linked series (current LCU) r = +0.998 (population-controlled +0.998) ■ And the pairs where nothing showed up - GDP per capita growth (annual %) and GNI, PPP (current international $) r = +0.049 - Forest rents (% of GDP) and GDP: linked series (current LCU) r = -0.045 - Forest rents (% of GDP) and GNI: linked series (current LCU) r = -0.045 **75 pairs came out with |r| below 0.05. Every one of them is in the table.** Cherry-picking is impossible by construction. ■ Method, stated plainly - For each indicator, the most recent year with at least 150 reporting countries was taken. The analysis was then restricted to the countries present in every indicator, so **every pair has the same n = 152**. - No outliers were removed. No winsorising, no trimming. - p values use an exact incomplete-beta computation. SciPy is not required to reproduce them. - The partial correlation is first-order, controlling for total population, with n-3 degrees of freedom. - **Every number in the files is program output. No number was typed by a human.** ■ Format - CSV is UTF-8 with BOM, so Excel opens it without mojibake. - wdi-economy_01.zip (0.37 MB) - SQLite opens with the Python standard library, DB Browser for SQLite, DBeaver and the rest. ■ Source and licence (attribution is required) World Bank Open Data - World Development Indicators https://api.worldbank.org/v2/ Licensing: https://datacatalog.worldbank.org/public-licenses The World Bank licenses its own datasets under **Creative Commons Attribution 4.0 International (CC BY 4.0)**, which permits commercial use. In its own words: "The Creative Commons Attribution 4.0 International license allows users to copy, modify and distribute data in any format for any purpose, including commercial use." You must credit the World Bank and state that the data was modified. A ready-to-paste attribution line is in LICENCE.txt. **This kit was prepared by EmpireOS. It is not a World Bank product, and the World Bank does not endorse it.** ■ On redistribution - stated plainly The underlying data is CC BY 4.0. As long as attribution is kept, redistributing it is permitted by that licence and we cannot forbid it. What this kit is worth is not the raw numbers: it is that 22 indicators were joined on one key, that all 231 pairs were published including the 75 that showed nothing, that each column carries its year and source, and that a population-controlled figure sits beside every raw one. ■ Cautions - **Correlation is not causation.** This is not investment, business or policy advice. - A relationship seen across countries must not be applied to individuals (the ecological fallacy). - Only population is controlled for. Income level, region, and measurement differences between countries are not. - Indicator years differ between columns; each column's year is printed in COLUMNS.csv and on the product image.